
I AM Interested - ($IAM.ASX)
A tortoise that starts rolling

I am not an accredited financial advisor. The content on this substack is my personal opinion and not financial advice. Please do your own research and consult a professional before making investment decisions. If you invest in stocks, consider using limit orders. Invest responsibly.
Off-Topic
Before delving into the analysis of the stock, let me briefly share how I actually came across it.
In early 2023, a Twitter account I follow posted a series of tweets about an interesting company in the bond sector. These tweets coincided with the time when the Fed announced interest rate hikes. It seemed logical to me that a company in the bond sector could be attractive and simultaneously serve as a good hedge for my portfolio. Since the mentioned Twitter account was still in the process of building a position in the stock and it appeared to be an illiquid company, the stock had not been publicly disclosed yet.
This prompted me to search for the company on the suspicious stock exchanges (Canada, UK, Australia) where the mentioned user is active. Following Peter Lynch's approach of "turning over the most rocks wins," after narrowing down my shortlist to a few stocks, none of my "turned rocks" seemed to match the revenue figures posted on Twitter. However, one stock (IAM.ASX) came close to the details I already knew, prompting me to analyze it more closely.
And what I discovered about the company was so intriguing that I stopped searching for the actual company and delved into the analysis.
Intro
Market Cap: 23M AUD
Enterprise Value: 18M AUD
Outstanding Shares: 311M
Debt: 8M
Profitability: Cashflow-negative (close to break-even)
Before you click any further at this point,
The following analysis is based on very positive developments indicating a significant turnaround that has taken place over the last 3 years.
My assumption is that at this point, the essential investments have been made, and the company is on the verge of long-term profitability.
This is evidenced by several consecutive profitable quarters with a minor setback, rapidly growing customer numbers (QoQ), significantly increasing revenues (QoQ), and the transformation of the company from a single revenue stream to 4 revenue streams with synergies, some of which are recurring. The company's management is composed of respected industry veterans who are incentivized with option plans and insider-ownership. But now, let's start from the beginning.
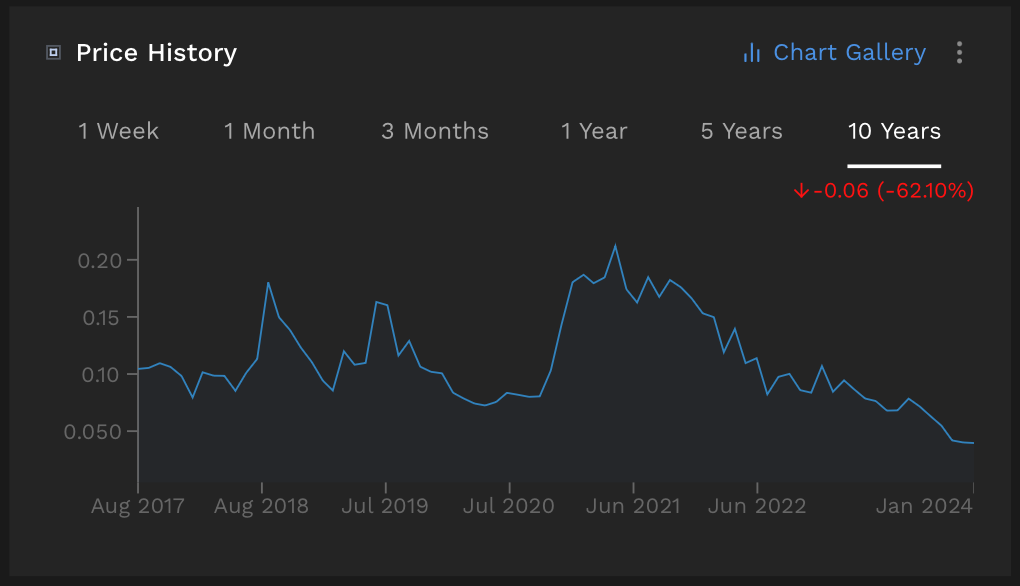
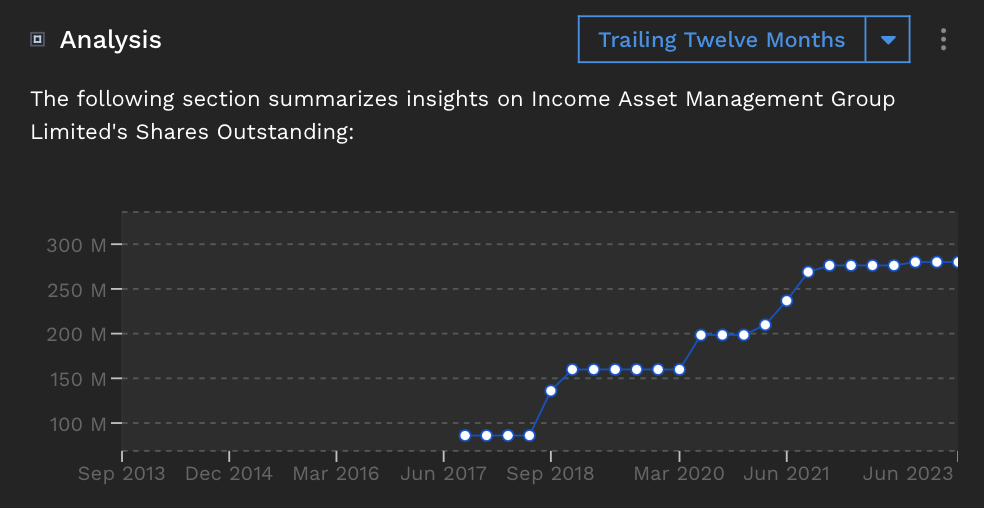
When you look at the stock price of this company, one might wonder at first glance why one should take a closer look at such a company. Not only is the stock price below the issuance price from now almost 7 years ago, but shareholders have also been diluted.
The number of outstanding shares has increased significantly, from a mere 100 million to almost 300 million shares, nearly tripling. Additionally, the debt has increased from approximately 1 million to about 4 million.
But famously, the best opportunities often arise from companies that are "out-of-favor," no longer actively followed, and have a lot of scorched earth behind them. Therefore, let's delve deeper into understanding how this development unfolded over the past years.
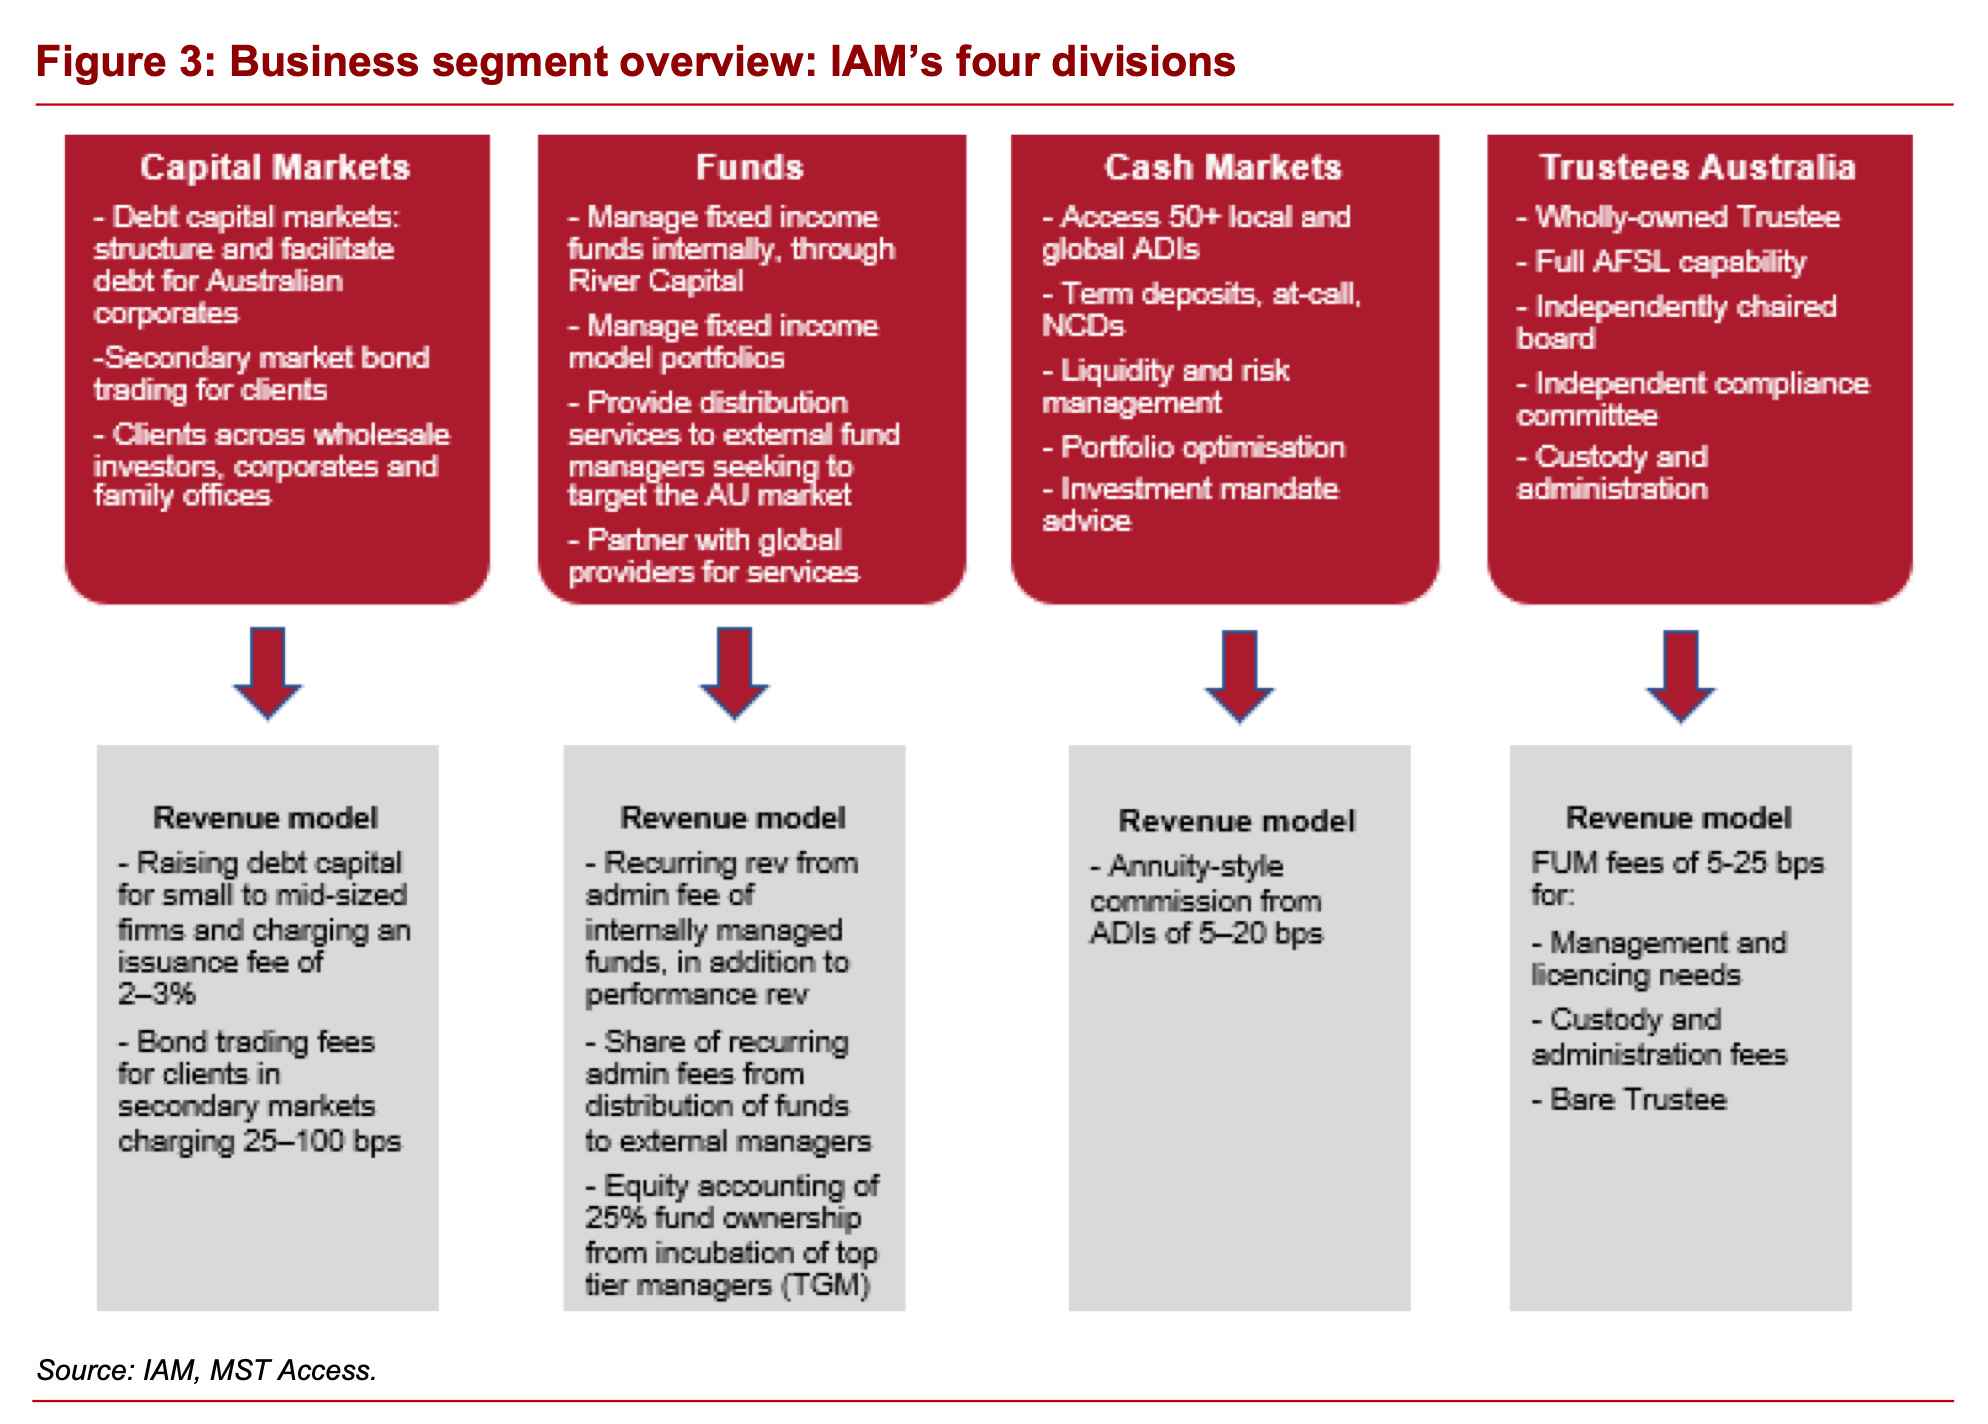
From one to four business segments with synergies
Deposits Business - Formerly Cashwerkz
Originally, everything started with a company named TAL, which had been publicly listed since 1987 and later transformed into Cashwerkz.
The primary focus of the company Cashwerkz was initially cash management by connecting to 50 ADIs (banks), allowing Cashwerkz customers to undergo onboarding only once with IAM. Cashwerkz then took care of optimizing the investment of customer deposits and earned a brokerage fee from banks.
What sounded like a reasonable business model was not sustainable during the low-interest-rate period from a few years ago. The reason for this is apparent. In times of low interest rates, there are much more attractive investment opportunities than keeping money in cash, and the margin was too low in the low-interest-rate environment (considering the banks' reluctance to accept cash at all) to operate profitably.
The company quickly attempted to expand into other more lucrative areas, rebranding itself as IAM (Income Asset Management). In early 2020, cash management for private investors was abandoned, focusing instead on "Mid-Market" SMEs, NGOs, and family offices that needed to manage larger amounts. Since then, with the rise in interest rates, a new opportunity has emerged in this segment, which appears attractive in a long-term higher interest rate environment.
Revenues (~ 9,4% of Total)
Management Fees & Distribution Fees
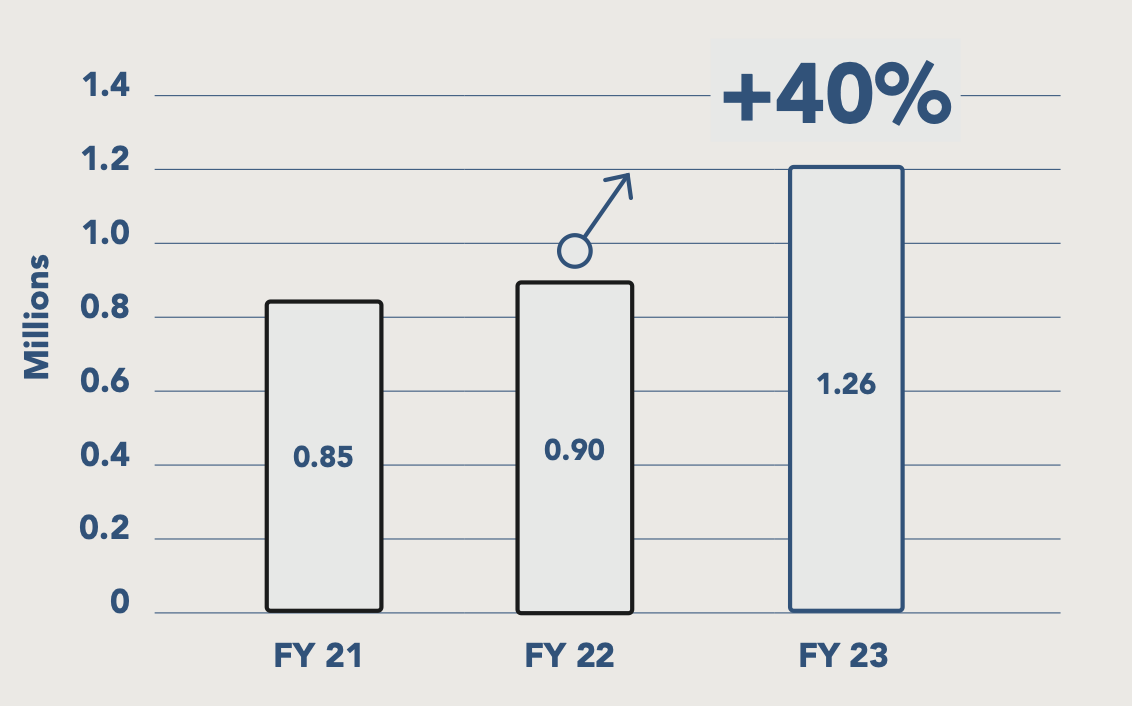
FY 2023
Cash AuA of $1.7B
Revenue of $1.3M, up 40% YoY (9,4% of Total Revenues)
TAL - Responsible Entity for Fund Managers
TAL holds full AFSL (Australian Financial Services License) licensing capabilities and specializes in providing custody, registry, and fund administration services. It plays a crucial role as a Bare Trustee in fixed-income transactions executed by IAM. TAL operates with an independently chaired board and maintains its own compliance committee to ensure regulatory adherence and governance.
In 2020, the Trustee Business of TAL underwent significant changes, allowing IAM to offer TAL's services to external fund managers. For this purpose, TAL, in collaboration with EY, developed an industry-wide compliance and management system. Today, TAL serves as the Responsible Entity (RE) for issued bonds on both primary and secondary levels.
Revenues (0% of Total)
1H23: 600k transaction-based + 60k recurring
Profitable since Q2 2023
FY23
Total value of Funds $624M, up from 0 YoY
First Revenues starting from FY24
Capital Markets
This business segment has been active only since February 2021 and has grown from 0 customers to over 1300, explaining the rapid increase in secondary bond trading. This growth is not incidental but is due to the fact that large banks have gradually withdrawn from this business over the past decades.
There are two revenue streams here. Firstly, IAM structures bonds for companies, distributing them through its network of affiliated advisors. Alternatively, IAM assists in the distribution of bonds structured by major banks. In the fiscal year 2023, IAM issued and distributed 10 bonds on its own and sold an additional 19 bonds for major banks. For sole bond issuance, IAM earns 2-3%, while for exclusive distribution, it earns only around 0.25%. Therefore, IAM's focus should be on increasingly issuing its own bonds. However, the total volume contributes to the Assets under Administration (AuA) and the fees IAM earns for holding the assets for its clients.
Secondly, IAM earns fees from the (secondary) trading of bonds by its customers.
And here comes a core statement of my investment thesis.
The secondary bond trading alone is expected to generate enough revenue in the coming years to cover IAM's ongoing expenses. All revenues generated through the issuance of bonds will then more or less directly contribute to the bottom line.
An interesting catalyst for IAM could be the recent partnership with the leading broker, Netwealth.
In Australia, bonds have typically been available to wholesale investors for purchase in large parcel sizes ($500,000 and over), however under the arrangement with Netwealth, IAM will provide investors with access to smaller bond parcels, starting at $50,000.
Source; https://incomeam.com/private-content/netwealth-makes-income-asset-management-bonds-available-via-platform/
IAM has made transparency a priority by charging fair spreads, presenting margins transparently, and not imposing exit fees when customers wish to switch to another provider.
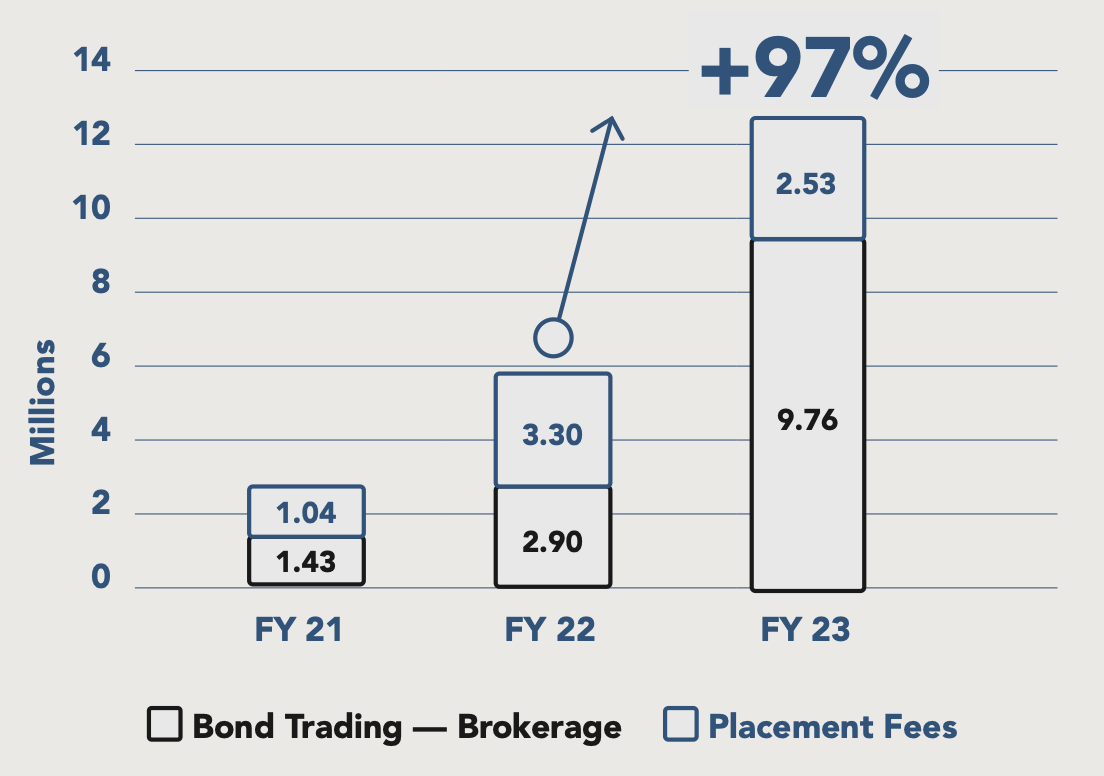
Revenues (~ 89% of Total)
Primary origination of Bonds
2-3% fees, Transaction-based
FY 23: $9.76M
Secondary Bond trading
0,25% - 1% Fees, Transaction-based
FY 23: $2.53
FY23: Primary and secondary market issues totalling $450M
thereof 10 deals worth 113M issued (2-3% Fees)
thereof 29 deals worth 339M distributed for banks (0,25-1% Fees)
Investment Model Bond Portfolio Service / Management of customer Portfolios Kundendepots (Recurring fees, still to be neglected)
Funds - der Inkubator
After the external availability of TAL created the prerequisites, IAM now offers various services to external fund managers (see revenues below). In addition, IAM acquires long-term stakes in funds.
Currently, IAM holds a 25% stake in TGM (Tactical Global Management). Shares in Fortlake Asset Management were sold shortly afterward to launch its own product (Bond-ETF) on the market.
In FY23, IAM acquired the Global Credit Opportunity Fund.
Due to the developments with Fortlake Asset Management, which was initially highly praised and then abandoned, this business segment needs further observation. Additionally, this business segment requires IAM to choose the right "best-performing" funds for participation because both the distribution success and the value of the acquired assets, through write-downs in the income statement, strongly depend on the performance of the funds. This business is thus not only associated with potentially high investments through share acquisitions but also with high uncertainties.
Revenues (1% of Total, still negligible)
Fees for backend (RE) and operational support
Acquisition of shares as an anchor investor (~25%) => Profit/Loss as a non-cash item through Equity Accounting
Dividends from fund shares
Distribution commissions through the advisor network
FY23: Service fee Revenue of $130k, up from $30k YoY
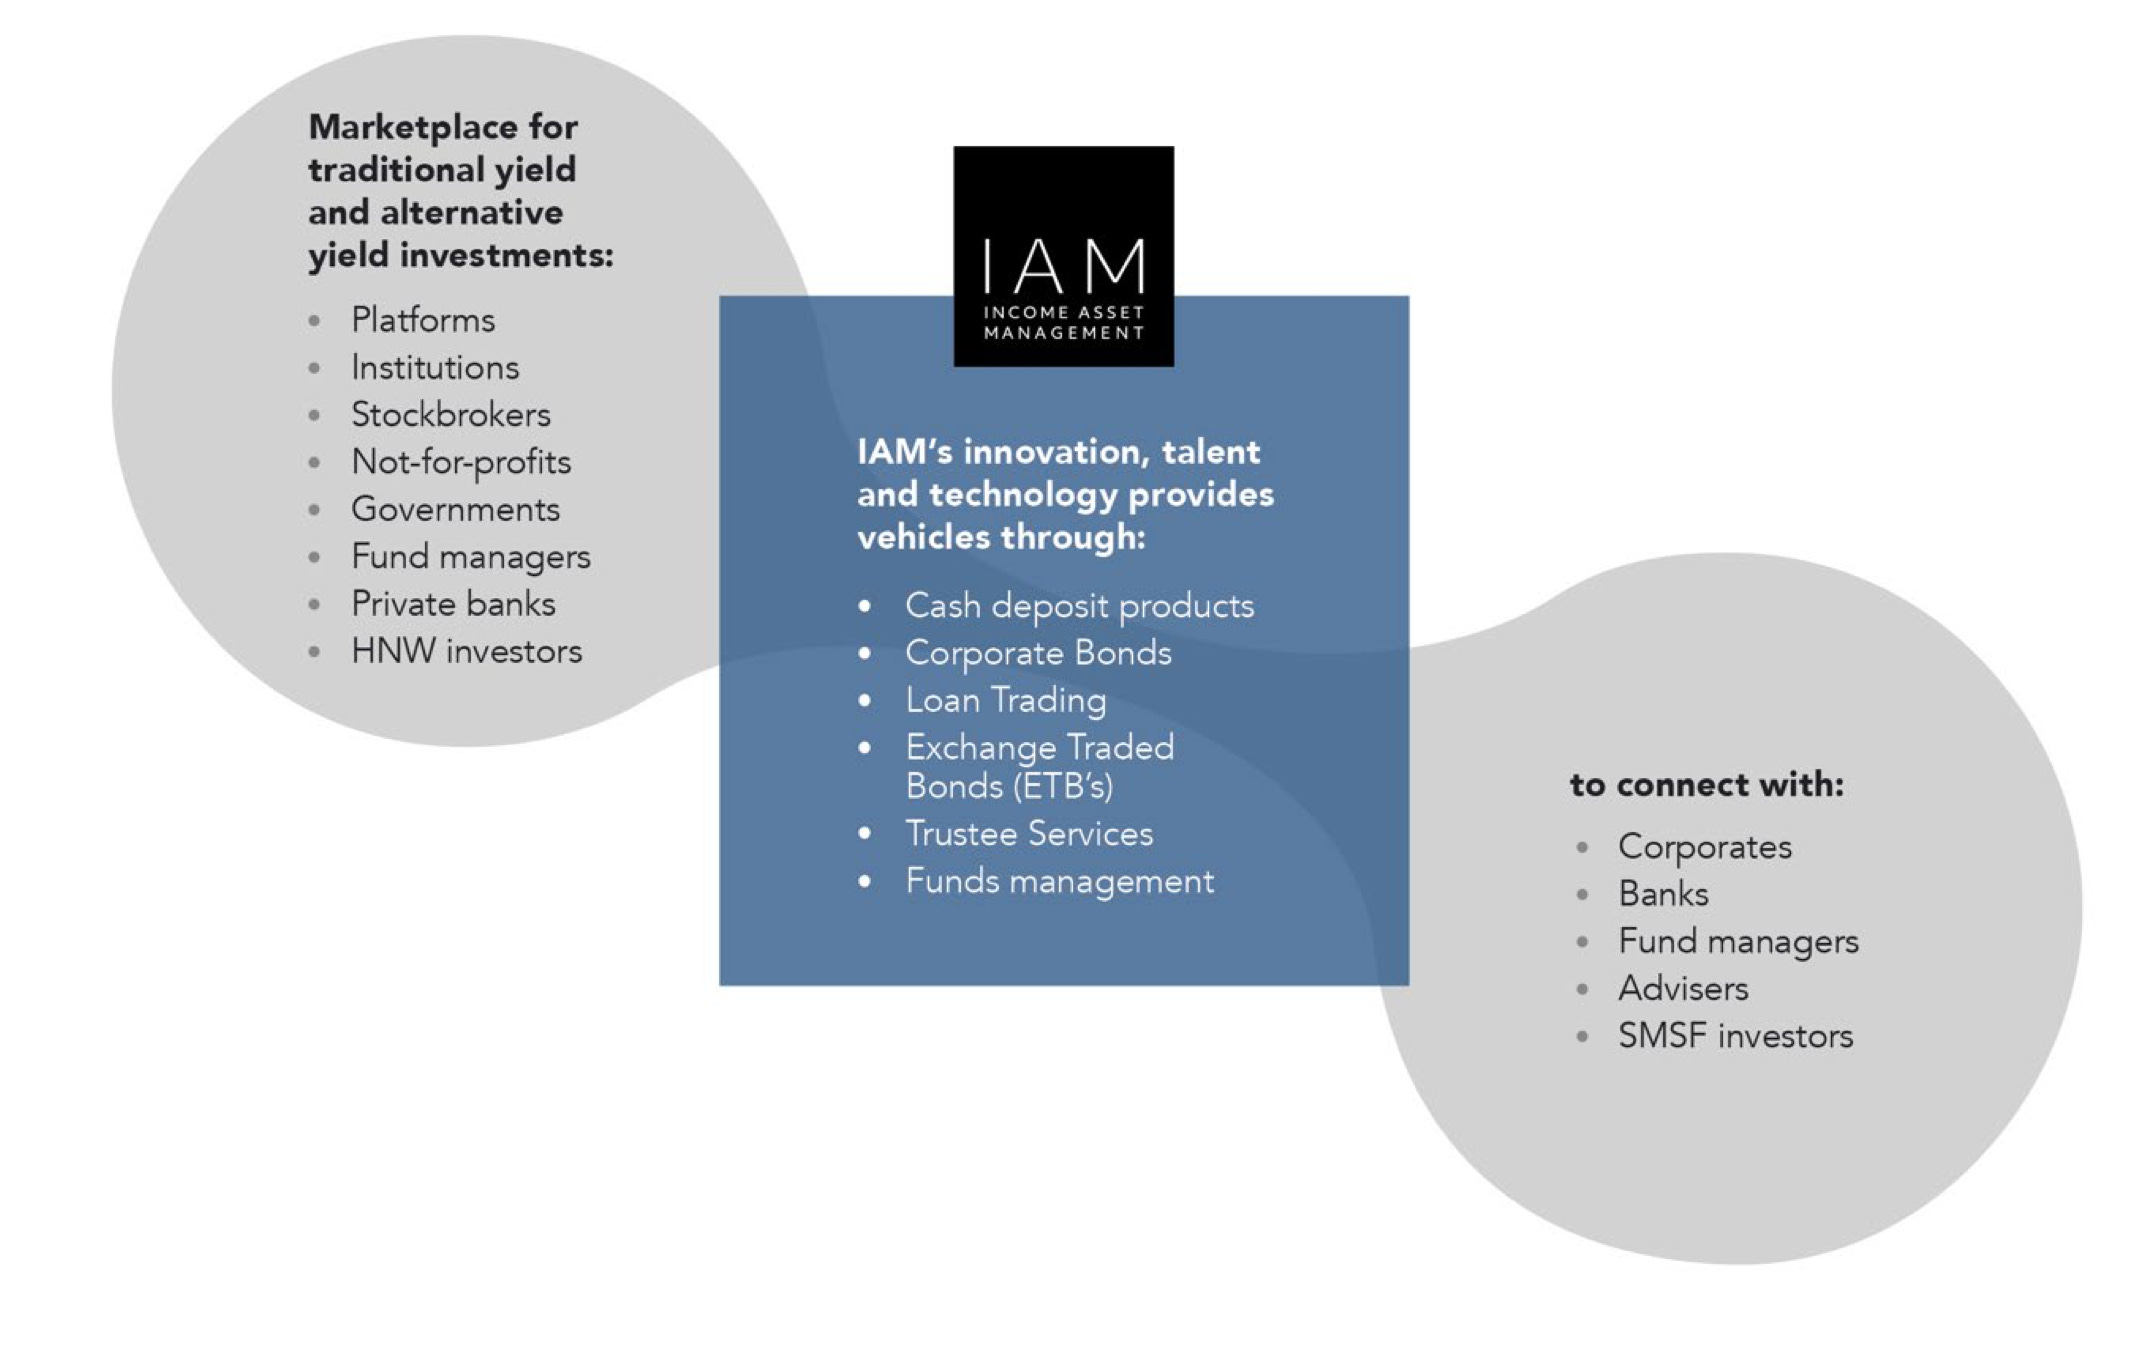
Graphical representation of the 4 pillars
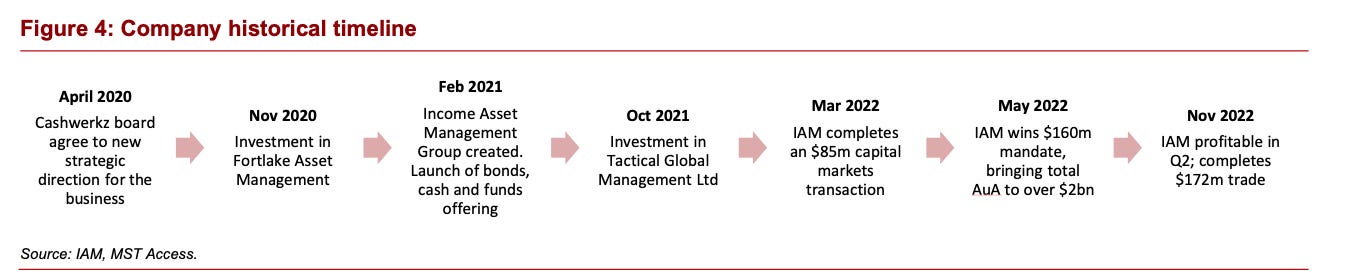
Overview over the history of IAM (starting from Cashwerkz)
For those who want to read about IAM's development in detail, I recommend the excellent article "A look under the hood" on IAM's homepage, written by none other than CEO Jon Lechte.
Positiv Developments
Next, I would like to briefly discuss the performance of each business segment and their importance for the future development of IAM.
However, I would like to emphasize in advance that the rising interest rates and the rekindled interest in fixed-income products such as bonds have proven to be a strong tailwind for the company. To what extent these positive developments will manifest themselves under potentially reversing market conditions remains to be seen.
Significantly increasing revenues in the Capital Markets Segment
Since the beginning of its transformation in 2020, IAM has managed to dramatically increase its revenues, achieving YoY growth rates of 238%, 72%, and 87%. Meanwhile, the stock price is at an all-time low.
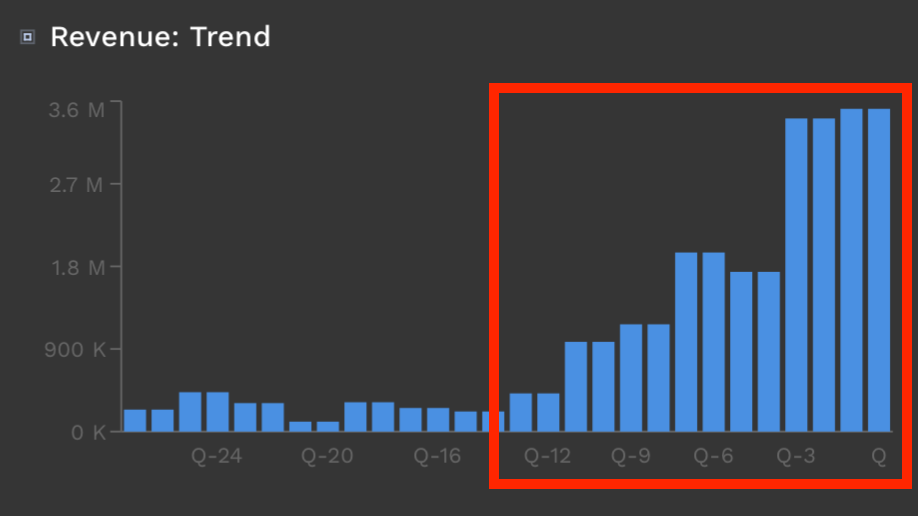
Note the significant increase in volumes from secondary bond trading since October 2020, from which IAM benefits through fees. While there is some volatility in this area, the volumes should settle at a high level in the long term, generating sufficient fees to cover IAM's costs.
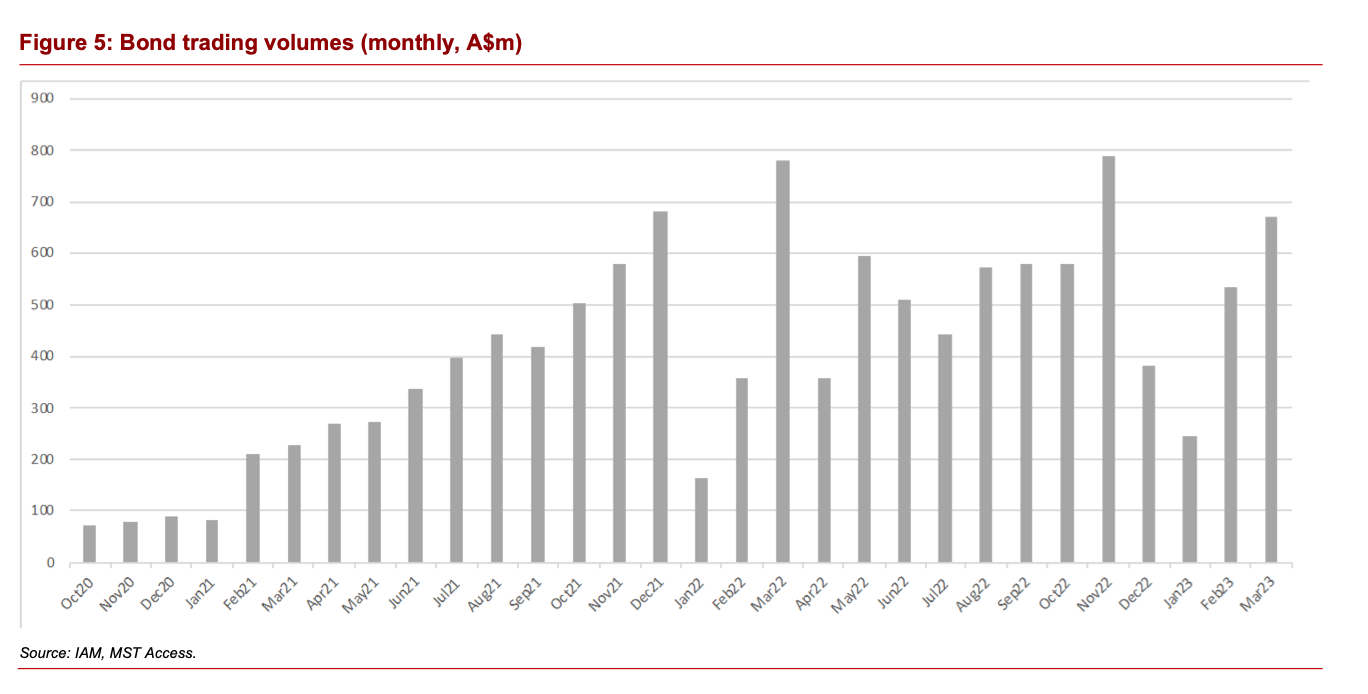
IAM has already stated that trading volumes are highly cyclical and depend on overall market volatility, i.e., the "readiness to trade." Accordingly, investors should adopt a long-term mindset here.
Strong operational leverage & scalability.
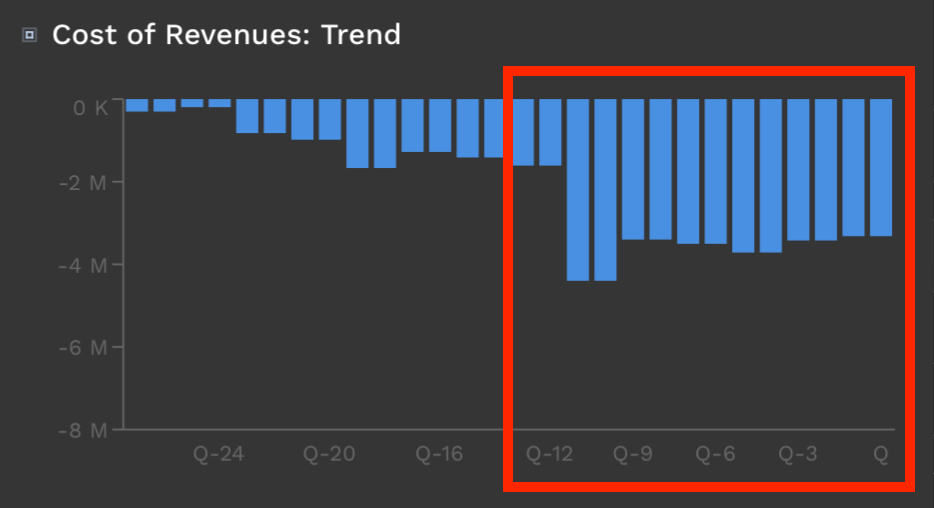
IAM demonstrates a strong operational leverage of its new business model through the "Adviser-First" model - impressively evidenced by decreasing operating expenses (at the elevated level of the new business model with significantly higher revenues) despite a threefold increase in revenues. The negative gross margin has evolved from -300% to the positive single-digit range since the transformation. With further revenue growth, the gross margin will continue to increase significantly.
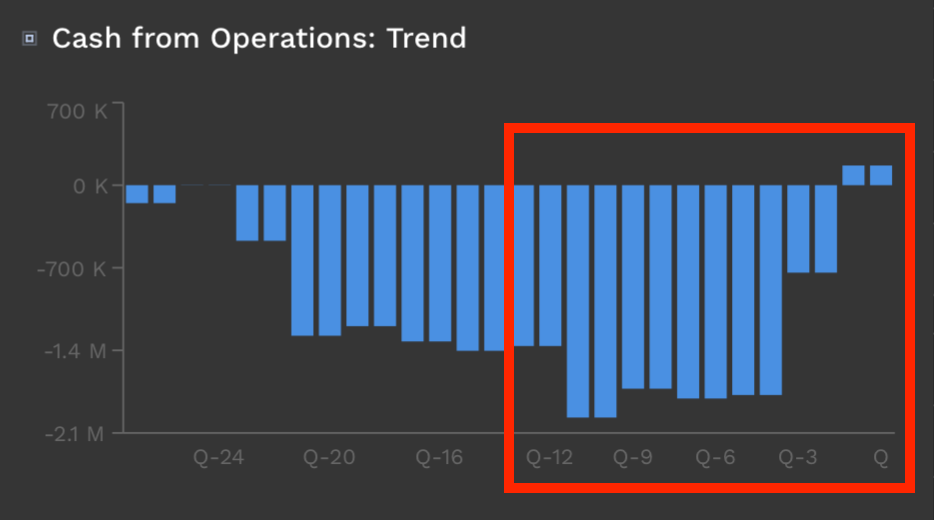
3 quarters of positive operating cash flow (+1 quarter of negative cash flow)
Due to the rapidly increasing revenues with decreasing operating costs and the operational leverage, IAM has been able to report positive operating cash flow in the last few quarters after years of losses, with a slight setback in the last quarter due to delays in the primary issuance of bonds, which will be reflected in the current quarter. As seen, the current dependence on transaction-based revenues still leads to some volatility in profitability, which should be smoothed out in the long term by the increase in recurring revenues from the Funds and RE business.
As we begin the new financial year, IAM Group still relies heavily on IAM Capital Markets and IAM Cash Markets for our revenue base. These divisions are funding not only their own businesses but also the growth aspirations of the whole group. In FY24 we expect this to change, as we expand and build into two exciting new business opportunities, Funds Management and Exchange Traded Bonds (ETB’s).
Source: https://incomeam.com/wp-content/uploads/2023/08/IAM_annual-_report_2023_FINAL.pdf
Strong Increase in Retail Clients
A positive driver for continued high revenues from the Capital Markets Segment is the ongoing increase in customers trading bonds through their advisors, who are in turn connected to IAM's platform.
It is important to emphasize that IAM does not maintain direct customer relationships in bond trading but operates solely through the advisor network. While this may result in lower margins due to the inability to sell advisory services directly to end customers, it provides the aforementioned advantage of scalability in bond trading and distribution.
At the same time, client retention is still very strong because bonds are typically held until maturity, and there is only a minimal risk of customers switching providers in the interim. IAM's "No-Exit-Fee" policy, therefore, does not pose a significant long-term risk across many clients.
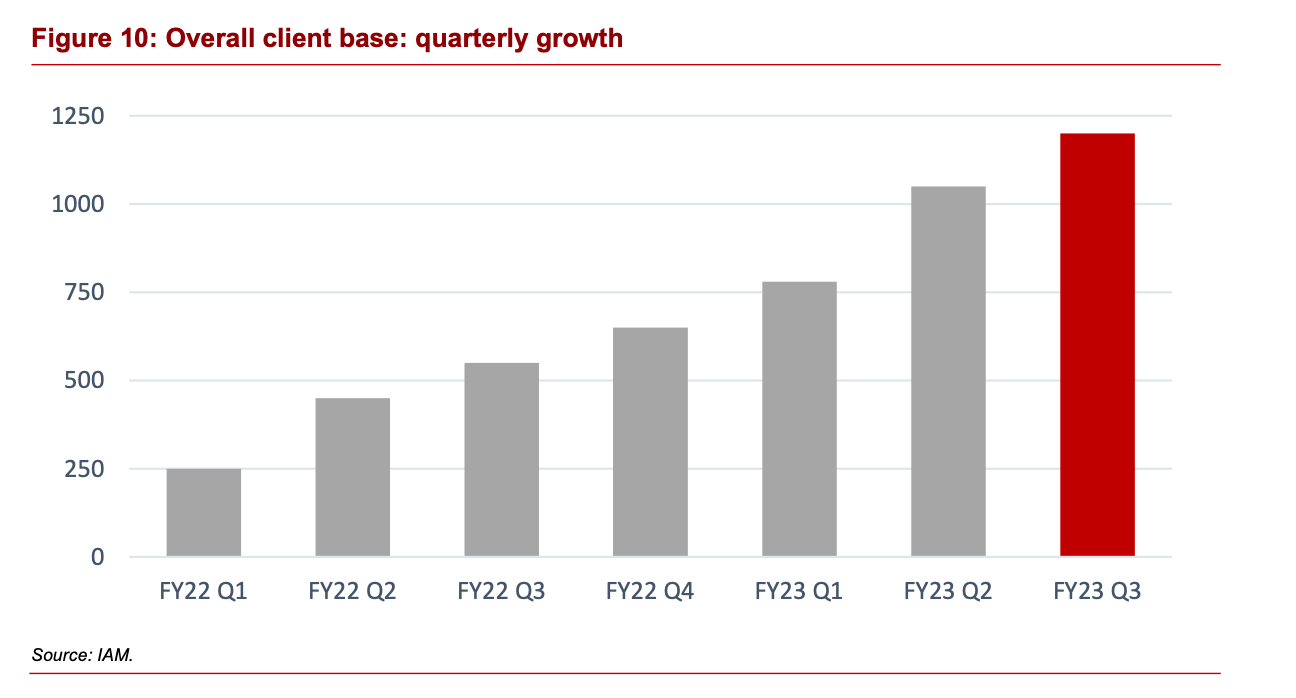
In the last two years, IAM has managed to acquire approximately 10-15 new retail clients per quarter through its advisor network, leading to a significant increase in customers QoQ.
The "Adviser-First" approach benefits IAM with relatively low operating costs, as one Customer Relationship Manager at IAM can serve many advisor networks. Thus, despite a substantial increase in revenue, operating costs have not significantly increased.
Opportunity
Re-rating through Break-Even and Sustainable Profitability, Coupled with Strong Growth
Growth continues to manifest through increasing customer numbers and rising secondary trading volumes.
An increasing number of proprietary bond issuances.
Rising recurring revenues make up a higher proportion of total revenue in the medium term.
Product innovations, such as the planned Exchange Traded Bonds ETF and the new internal fund, are experiencing significant inflows.
Bullish statements from the management, against which I will gauge the company in the coming quarters:
As we begin the new financial year, IAM Group still relies heavily on IAM Capital Markets and IAM Cash Markets for our revenue base. These divisions are funding not only their own businesses but also the growth aspirations of the whole group. In FY24 we expect this to change, as we expand and build into two exciting new business opportunities, Funds Management and Exchange Traded Bonds (ETB’s).
https://incomeam.com/wp-content/uploads/2023/08/IAM_annual-_report_2023_FINAL.pdf, p.9
To be clear, we expect both the incumbent Capital Markets and Cash Markets businesses to grow significantly in FY24 – enough to make the group cleanly profitable.
https://incomeam.com/wp-content/uploads/2023/08/IAM_annual-_report_2023_FINAL.pdf, p.9
Risks
IAM has announced plans to hire additional revenue-writing staff, which could increase operating costs before full productivity is achieved.
High volatility in trading volumes and new bond issuances continues to result in losses.
Declining interest rates negatively impact Cash Markets and Capital Markets – the revenue streams on which IAM is heavily reliant.
Further dilution of shareholders may occur.
Insider Ownership
Ordinary shares held in IAM as of FY23
J Nantes / Chairman: 3,5% of Total
J Lechte / CEO: 4,8% of Total
B Adcock / Director and Founder: 19% of Total
C Swanger / Director: 0,7% of Total
Jon Lechte further holds 8,8 Million Performance Rights with a share-price hurdle of $0.45, exercisable on or before 1-April-25. Those wer granted in April 2020, when the share price hovered around $0.15. I am not sure if Jon still thinks there is a realistic chance that vesting criteria will be met, but it’s definitive a huge incentive.
Valuation
If we assume similar economics going forward, Revenue will reach $20M in FY24, again mainly driven by Cash and Capital Markets. Compared to the Enterprise Value of $18M this leads to a valuation of < 1x Revenue for a high-growth company on the edge of profitability. I assume EBITDA to be somewhere between 3 and 4M, leading to a valuation of 5-7x EBITDA on basis of FY24. I think those estimations are reasonable and not overly optimistic.
I will acquire an entry-position for Jesper at the current price-level and add to the position if my assumptions prove to be correct over the next quarters.